Tag: Data Strategy

A well-crafted Data Strategy empowers businesses to optimize data management, enhance decision-making, and achieve long-term goals through structured and actionable insights.

  • Understanding Data Granularity for Business Reporting

    Understanding Data Granularity for Business Reporting

    Why Data Granularity Matters and How to Get Business Reporting Right

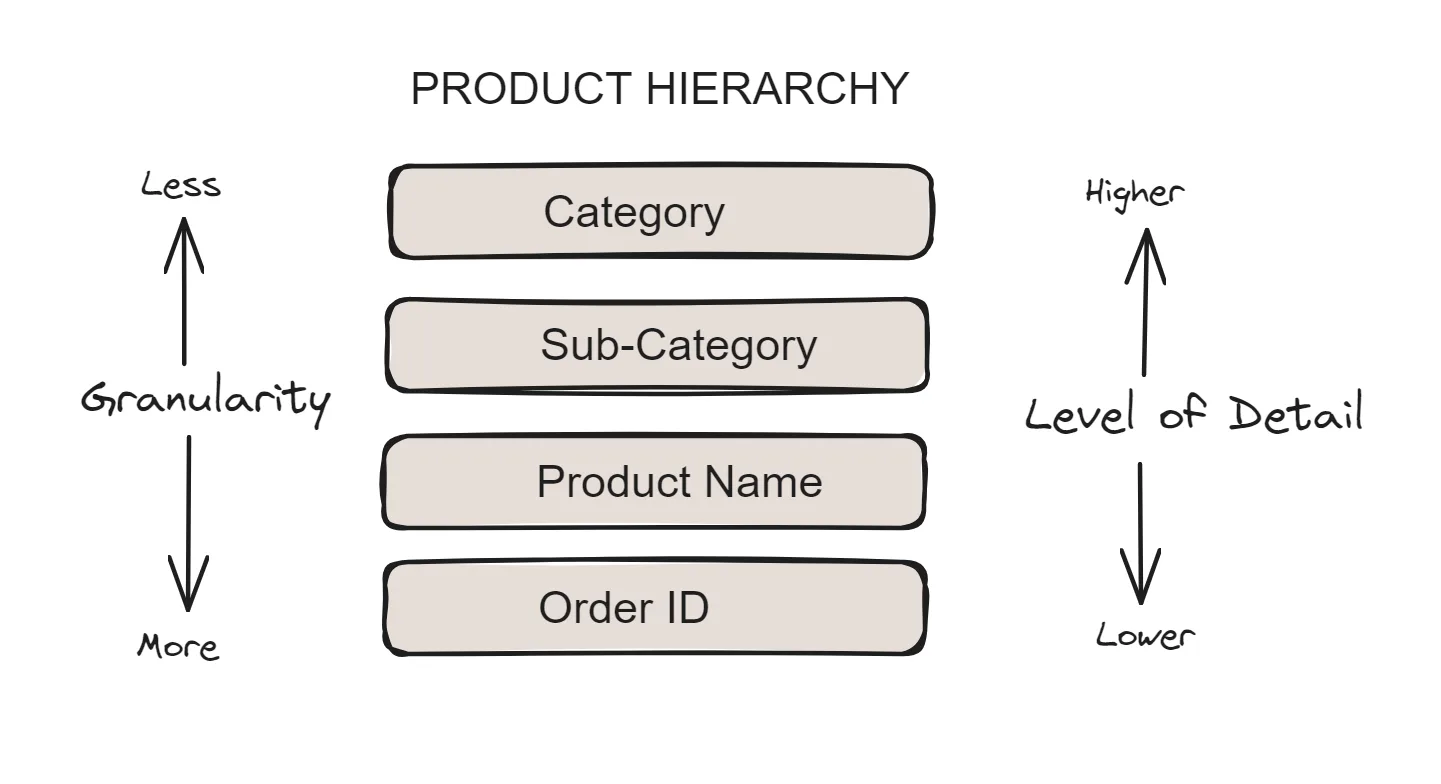
    Data granularity is one of the most foundational concepts in business intelligence and data analytics. It affects how your organization collects, structures, analyzes, and acts on information. Without the right level of detail, reports fall short, dashboards mislead, and strategies lose their edge.

    So, what exactly is data granularity – and how do you determine the right level for your use case?

    Let’s break it down and explore how understanding and managing granularity can transform your reporting into a decision-making powerhouse.

    more
  • Construction Proposal Software for Automated Proposal Drafting

    Construction Proposal Software for Automated Proposal Drafting


    Drafting Proposals for My Construction Company Takes Too Long!

    In the construction industry, time is money – and nowhere is that more apparent than in the pre-sales and proposal phases of a project. Drafting proposals is one of the most time-consuming, repetitive, and error-prone tasks for many construction firms. Manually assembling cost estimates, scopes of work, timelines, and materials lists across dozens of potential jobs can drain valuable internal resources that could otherwise be focused on billable work. Your company needs construction proposal software

    We Need Construction Proposal Software that Automates Drafting Proposals

    That’s where an automated proposal-making web application comes in. When done right, this kind of tool doesn’t just save time – it becomes a cornerstone of operational efficiency, consistency, and client satisfaction.

    If you’ve been thinking, “We need to build construction proposal software for automated proposal drafting” – you’re not alone. And if you’re wondering, “What tools and software will DieseinerData use to build it?” – you’re in the right place.

    MORE
  • Data Analytics: A Guide to Getting Started

    Data Analytics: A Guide to Getting Started

    Why Data Analytics Is More Than Just Numbers

    In today’s fast-paced digital economy, data has become the lifeblood of competitive businesses. People often call it the “new oil,” but unlike crude oil, raw data doesn’t hold value until you refine it with strategy, technology, and expertise. This refinement process is what data analytics deliver – and it’s exactly what DieseinerData specializes in.

    If you’ve been curious about the power of analytics but feel unsure where to begin, you’re not alone. Many companies struggle with questions like:

    • What kind of analytics tools do we need?
    • How do we collect the right data?
    • What’s actually possible with the data we have?

    In this guide, you’ll learn the step-by-step process of starting your analytics journey with a trusted partner like DieseinerData. We’ll break down what data analytics is, why it matters, and how to go from data confusion to clarity.

    more
  • Data Visualizations vs. Dashboards: The Key Differences

    Data Visualizations vs. Dashboards: The Key Differences

    What’s the Real Difference-and Why It Matters

    In the ever-evolving world of data analytics, the terms data visualizations and dashboards are often used interchangeably. But while they’re closely related, they serve different purposes. Understanding where they overlap and where they don’t is essential for any organization looking to make smarter, faster, and more informed decisions.

    At DieseinerData, we believe that demystifying this relationship is the key to building tools that not only display information but also tell stories, surface insights, and enable action. In this post, we’ll break down visualizations and dashboards, explain how they complement each other, and show you how to use them to unlock the full power of your data.

    more
  • Our Company Needs a Web App for Data Analytics Operations

    Our Company Needs a Web App for Data Analytics Operations

    What Do we Mean When we Say “Web App”?

    In today’s fast-paced digital world, buzzwords like cloud, automation, machine learning, and web app are everywhere. While many people understand what a mobile app is, the term “web app” can feel vague – especially in the context of data analytics operations. So, what exactly does a data analytics company mean when they say they’ll build you a web app?

    In this post, we’ll unpack the concept of a web app from the perspective of a data analytics firm and data analytics operations. More importantly, you’ll discover how it differs from websites, when it’s the right solution for your business, and how real companies are already using them to save time, drive revenue, and scale smarter.

    more
  • What Value Will Automated Reporting Bring My Company?

    What Value Will Automated Reporting Bring My Company?

    In today’s data-driven business landscape, companies of all sizes are inundated with information – metrics, KPIs, trends, customer behaviors, and more. While access to data has never been easier, the ability to interpret, share, and act on that data efficiently remains a significant challenge for many organizations. That’s where automated reporting steps in.

    For many businesses, automated reporting is more than a convenience – it’s a strategic necessity. But what exactly is it, and what kind of value does it bring? This blog post dives deep into the practical benefits of automated reporting and explores how your business can leverage it to unlock measurable value across departments.

    MORE
  • An Introductory Guide to Data Visualizations

    An Introductory Guide to Data Visualizations

    Making Your Data Insights Clear, Engaging, and Actionable

    In today’s fast-paced business environment, raw numbers alone rarely tell a compelling story. Data visualization bridges that gap, transforming complex datasets into visuals that are easy to understand and act upon. The right visualization can highlight trends, uncover relationships, and drive confident decision-making. However, with so many visualization types available, knowing which one to use for a given scenario can feel overwhelming.

    This guide will walk you through the most common types of data visualizations, when to use them, when to avoid them, and how each can enhance your storytelling. As a data analytics company, DieseinerData uses these visual tools daily to help clients move from raw numbers to meaningful, actionable insights.

    more
  • 10 Rules for Better Data Visualizations

    Choosing the Right Tool for the Right Project

    In today’s data-driven world, the ability to transform complex information into clear, actionable insights is crucial. Data visualization is an indispensable tool that helps businesses, analysts, and decision-makers interpret vast amounts of data efficiently. However, not all visualizations are created equal. Poorly designed graphs and charts can obscure key insights, mislead audiences, and hinder decision-making.

    To harness the full power of data visualizations, it is essential to use best practices that enhance clarity, engagement, and comprehension. In this post, DieseinerData explores the best data visualization techniques to ensure that your data tells a meaningful story.

    More
  • Data Engineering within Company Data Analytics Operations

    Data Engineering within Company Data Analytics Operations

    Like oil to a car, data fuels your business.

    In today’s digital economy, data has become the new oil – an invaluable resource that powers decision-making, drives innovation, and fuels the technology we use every single day. From personalized shopping recommendations to real-time logistics tracking, data is at the heart of modern business success.

    Yet, while we hear plenty about data science, machine learning, and analytics, the crucial role of data engineering often remains behind the scenes. This is surprising because without data engineering, there would be no reliable data for those flashy analytics tools or AI models to process.

    So, how exactly does raw, messy, and often chaotic data transform into clean, structured, and actionable insights?

    The answer lies in data engineering – the backbone of the modern data ecosystem.

    more
  • Excel VBA vs. Custom Data Solutions: The Time for an Analytics Upgrade

    Excel VBA vs. Custom Data Solutions: The Time for an Analytics Upgrade

    Why It’s Time to Reevaluate Your Analytics Tools

    For decades, Excel has been the cornerstone of business data management, and with Excel VBA, it offers advanced capabilities for automation and custom solutions. From sales reports to budget tracking, it has earned a reputation as a familiar, flexible, and cost-effective tool. Countless professionals rely on it daily, leveraging pivot tables, conditional formatting, and formulas to wrangle their data into meaningful insights.

    However, as businesses scale, data grows in both volume and complexity. This is where Excel starts showing its cracks. Eventually, you may find yourself fighting slow load times, version conflicts, and data entry errors instead of unlocking insights. At this point, an analytics upgrade, a custom web-based analytics platform becomes less of a luxury and more of a necessity.

    In this post, we’ll explore:

    • The undeniable strengths of Excel
    • Its major limitations for growing businesses
    • Key signs it’s time to upgrade
    • The benefits of custom analytics solutions
    • How to choose the right platform for your needs
    MORe