Tag: Data Analytics

Discover comprehensive guides and practical applications of data analytics across industries. From data mining and market research to performance tracking and trend analysis, learn how organizations leverage data-driven strategies to optimize operations, enhance customer experiences, and drive growth through advanced analytics solutions.

  • What is Bespoke Reporting in Data Analytics?

    What is Bespoke Reporting in Data Analytics?

    An Inspiring Case Study of How Custom Insights Transformed a Small Business

    In a data-saturated world, businesses of every size are waking up to the power of analytics. But having data is not the same as understanding it – and understanding it in the right way is often the make-or-break factor in strategic growth.

    One-size-fits-all dashboards and pre-packaged reports may work for surface-level insights, but they fall short when a business needs clarity, nuance, and specificity. That’s where bespoke reporting comes in.

    Whether you’re running a boutique e-commerce store, a multi-location service firm, or a high-touch consultancy, bespoke reporting can turn data from a confusing mess into a strategic superpower.

    Let’s unpack what bespoke reporting means, why it matters, and how it changed the game for one small business that dared to bet on custom data analytics.

    MoRE
  • An Introductory Guide to Data Visualizations

    An Introductory Guide to Data Visualizations

    Making Your Data Insights Clear, Engaging, and Actionable

    In today’s fast-paced business environment, raw numbers alone rarely tell a compelling story. Data visualization bridges that gap, transforming complex datasets into visuals that are easy to understand and act upon. The right visualization can highlight trends, uncover relationships, and drive confident decision-making. However, with so many visualization types available, knowing which one to use for a given scenario can feel overwhelming.

    This guide will walk you through the most common types of data visualizations, when to use them, when to avoid them, and how each can enhance your storytelling. As a data analytics company, DieseinerData uses these visual tools daily to help clients move from raw numbers to meaningful, actionable insights.

    more
  • 10 Rules for Better Data Visualizations

    Choosing the Right Tool for the Right Project

    In today’s data-driven world, the ability to transform complex information into clear, actionable insights is crucial. Data visualization is an indispensable tool that helps businesses, analysts, and decision-makers interpret vast amounts of data efficiently. However, not all visualizations are created equal. Poorly designed graphs and charts can obscure key insights, mislead audiences, and hinder decision-making.

    To harness the full power of data visualizations, it is essential to use best practices that enhance clarity, engagement, and comprehension. In this post, DieseinerData explores the best data visualization techniques to ensure that your data tells a meaningful story.

    More
  • Data Engineering within Company Data Analytics Operations

    Data Engineering within Company Data Analytics Operations

    Like oil to a car, data fuels your business.

    In today’s digital economy, data has become the new oil – an invaluable resource that powers decision-making, drives innovation, and fuels the technology we use every single day. From personalized shopping recommendations to real-time logistics tracking, data is at the heart of modern business success.

    Yet, while we hear plenty about data science, machine learning, and analytics, the crucial role of data engineering often remains behind the scenes. This is surprising because without data engineering, there would be no reliable data for those flashy analytics tools or AI models to process.

    So, how exactly does raw, messy, and often chaotic data transform into clean, structured, and actionable insights?

    The answer lies in data engineering – the backbone of the modern data ecosystem.

    more
  • Excel VBA vs. Custom Data Solutions: The Time for an Analytics Upgrade

    Excel VBA vs. Custom Data Solutions: The Time for an Analytics Upgrade

    Why It’s Time to Reevaluate Your Analytics Tools

    For decades, Excel has been the cornerstone of business data management, and with Excel VBA, it offers advanced capabilities for automation and custom solutions. From sales reports to budget tracking, it has earned a reputation as a familiar, flexible, and cost-effective tool. Countless professionals rely on it daily, leveraging pivot tables, conditional formatting, and formulas to wrangle their data into meaningful insights.

    However, as businesses scale, data grows in both volume and complexity. This is where Excel starts showing its cracks. Eventually, you may find yourself fighting slow load times, version conflicts, and data entry errors instead of unlocking insights. At this point, an analytics upgrade, a custom web-based analytics platform becomes less of a luxury and more of a necessity.

    In this post, we’ll explore:

    • The undeniable strengths of Excel
    • Its major limitations for growing businesses
    • Key signs it’s time to upgrade
    • The benefits of custom analytics solutions
    • How to choose the right platform for your needs
    MORe
  • How Data Analytics Helped a Local Business Scale Nationally

    How Data Analytics Helped a Local Business Scale Nationally

    In today’s digital age, data analytics has become the backbone of business success. Companies that leverage data-driven decision-making gain a competitive edge, streamline operations, and uncover growth opportunities. For small businesses, analytics can be the catalyst that transforms them from a local entity into a national powerhouse. In this case study, DieseinerData explores how a small, family-owned coffee roasting company used data analytics to expand its reach, optimize its operations, and scale nationally.

    more
  • Beginner’s Guide to Key Data Analytics Terms

    Key Analytics Terms to Make Informed Decisions

    In today’s data-driven world, business professionals must understand key analytics terms to make informed decisions. Whether you’re working with data analysts or just starting your journey in business intelligence, knowing these fundamental concepts will help you communicate effectively and leverage data insights. We here at Dieseinerdata wrote a glossary of essential analytics terms every business professional should know.

    more
  • A Comprehensive Guide to CRISP-DM: Structuring Your Data Analytics Process with Precision

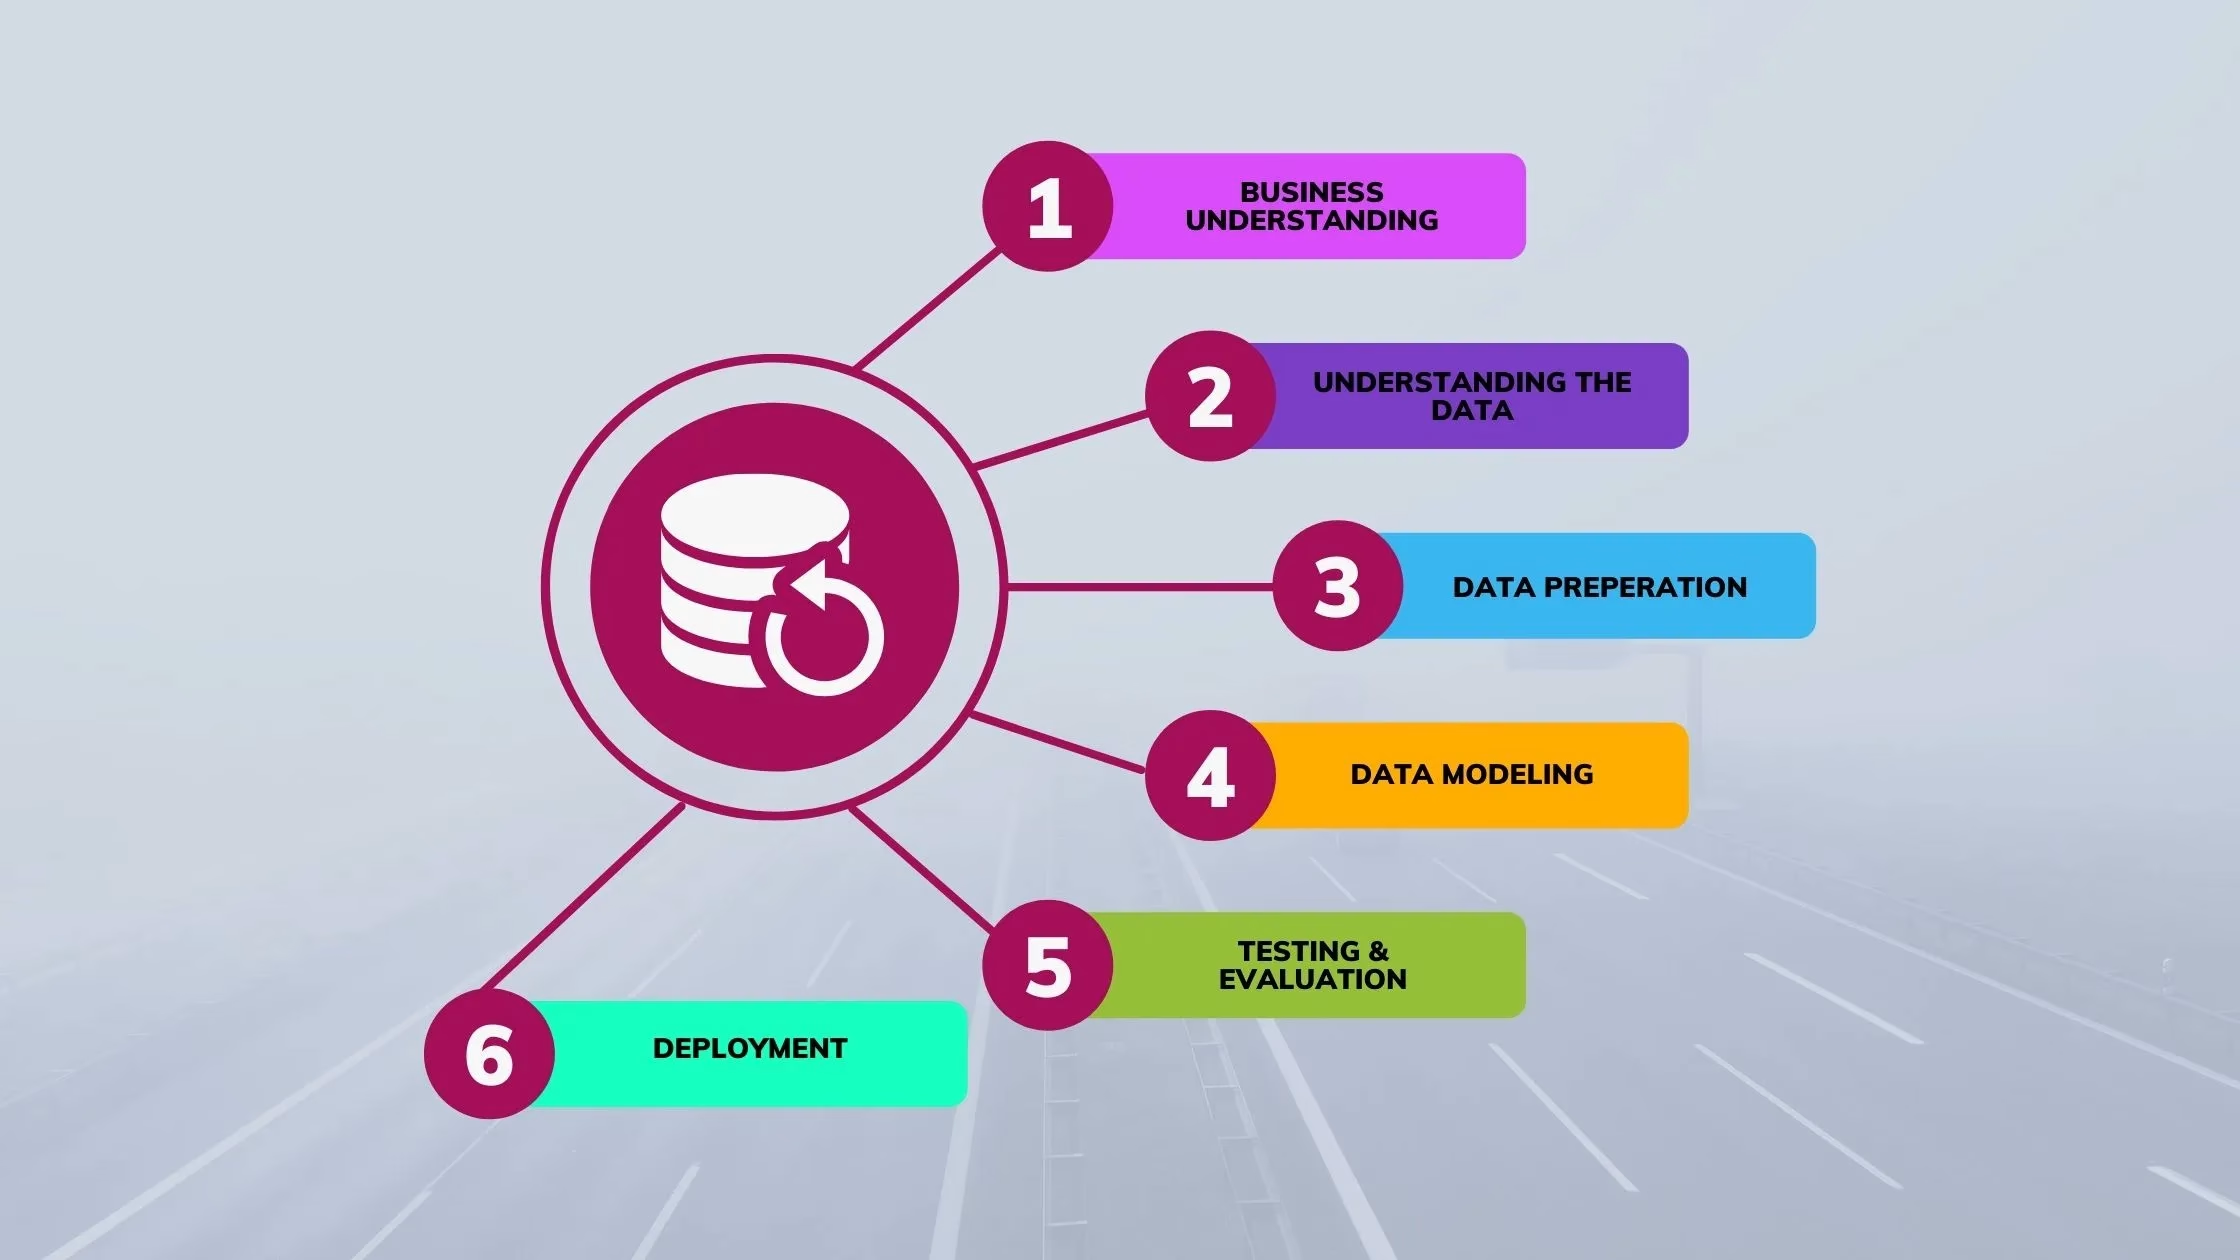
    A Comprehensive Guide to CRISP-DM: Structuring Your Data Analytics Process with Precision

    Introduction: Why Methodology Matters in Data Projects

    In today’s data-driven world, companies generate more information than ever before. Yet raw data alone is not valuable – it’s what you do with it that counts. That’s why frameworks like CRISP-DM (Cross-Industry Standard Process for Data Mining) are so important.

    Whether you’re building a recommendation engine, cleaning messy customer records, or forecasting sales, a methodical approach ensures clarity, quality, and results. CRISP-DM remains one of the most widely adopted methodologies for structuring data analytics and mining workflows. Its major strength lies in its flexibility – you can return to previous phases as new insights emerge.

    In this post, we’ll walk through the full CRISP-DM lifecycle, show how it ties into practical data cleaning, and explain how your business can benefit from using it consistently.

    More
  • How to Prepare and Clean Data for Better Company Insights

    How to Prepare and Clean Data for Better Company Insights

    Clean Data = The Foundation for Your Company

    In the fast-paced world of data analytics and business intelligence, clean, well-prepared data is not a “nice to have” – it’s a necessity. Without it, every chart, report, and business decision risks being built on shaky ground. Poor data quality leads to misleading conclusions, flawed strategies, and wasted resources.

    Before diving into advanced analytics or designing stunning dashboards, your first priority should be ensuring that your data is accurate, consistent, and reliable. That’s because better data leads to better decisions – and in a competitive market, that advantage is priceless.

    In this comprehensive guide, DieseinerData walks you through the essential steps to clean and prepare your data, ensuring your analytics deliver the insights your business needs.

    MORe
  • AI and Automation in Data Analytics: The Hype vs. Reality?

    AI and Automation in Data Analytics: The Hype vs. Reality?

    Understanding the Balance Between Innovation and Expectation

    In today’s fast-moving world of data analytics, artificial intelligence (AI) and automation dominate conversations. Organizations across industries pour resources into AI-driven analytics, envisioning a future where machines instantly transform raw data into actionable insights.

    However, not every promise matches reality. While some AI applications genuinely revolutionize decision-making, efficiency, and accuracy, others are oversold and underdeliver. Businesses that understand both the strengths and limitations of AI can avoid costly mistakes and focus their efforts where the technology adds true value.

    more